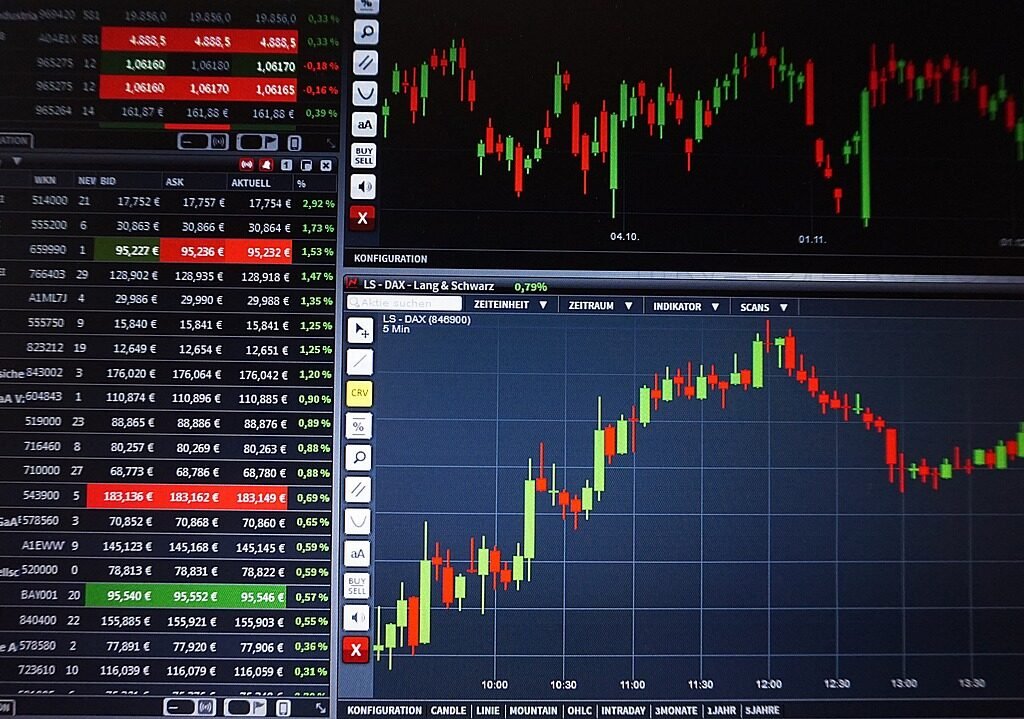
Trading indicators are tools that traders use to analyze financial markets and identify potential trading opportunities. They are mathematical calculations based on the price and/or volume of a financial asset, and are used to confirm or deny a trend, identify overbought or oversold conditions, and provide signals for buying or selling.
There are many different types of trading indicators, each with its own unique strengths and weaknesses. In this blog post, we will provide an overview of some of the most popular indicators used by traders, as well as some tips for how to use them effectively.
Moving Averages Moving averages are one of the most widely used trading indicators. They are calculated by taking the average price of a financial asset over a specified period of time, and are used to identify the overall direction of a trend. Moving averages can be plotted on a chart in various ways, including simple moving averages (SMA), exponential moving averages (EMA), and weighted moving averages (WMA).
The most common use of moving averages is to identify the crossover between two different periods of time. When the short-term moving average (e.g. 50-day SMA) crosses above the long-term moving average (e.g. 200-day SMA), this is considered a bullish signal. Conversely, when the short-term moving average crosses below the long-term moving average, this is considered a bearish signal.
Relative Strength Index (RSI) The RSI is another widely used trading indicator. It measures the strength of a financial asset’s price action by comparing the average gains and losses over a specified period of time. The RSI is plotted on a scale of 0-100, with readings above 70 indicating overbought conditions and readings below 30 indicating oversold conditions.
Traders use the RSI to identify potential trend reversals. When the RSI crosses above 70, this is considered a sell signal, indicating that the asset may be overvalued and due for a price correction. When the RSI crosses below 30, this is considered a buy signal, indicating that the asset may be undervalued and due for a price increase.
Moving Average Convergence Divergence (MACD) The MACD is a popular trading indicator that combines two moving averages and a histogram. It is used to identify changes in the momentum of a trend. The MACD is calculated by subtracting the 26-day EMA from the 12-day EMA, and plotting the result as a histogram. A signal line (usually a 9-day EMA) is then plotted on top of the histogram to provide buy and sell signals.
When the MACD line crosses above the signal line, this is considered a bullish signal, indicating that the momentum of the trend is increasing. Conversely, when the MACD line crosses below the signal line, this is considered a bearish signal, indicating that the momentum of the trend is decreasing.
Bollinger Bands Bollinger Bands are a popular trading indicator used to measure volatility. They are plotted on a chart as a series of bands around a moving average, with the width of the bands representing the volatility of the asset. When the asset is experiencing high levels of volatility, the bands widen, and when the asset is experiencing low levels of volatility, the bands narrow.
Traders use Bollinger Bands to identify potential trend reversals. When the price of the asset moves above the upper band, this is considered a sell signal, indicating that the asset may be overbought and due for a price correction. When the price of the asset moves below the lower band, this is considered a buy signal, indicating that the asset may be oversold and due for a price increase.
Fibonacci Retracement Fibonacci retracement is a trading indicator based on the mathematical sequence of numbers discovered by Leonardo Fibonacci

different indicators are useful for different purposes and trading styles. Traders often use a combination of indicators to gain a comprehensive understanding of the market and identify potential trading opportunities.
That being said, some of the most widely used and respected indicators include moving averages, relative strength index (RSI), moving average convergence divergence (MACD), Bollinger Bands, and Fibonacci retracement. Each of these indicators can provide valuable insights into market trends, momentum, volatility, and potential turning points.
Moving averages, for example, are a popular indicator for identifying the overall direction of a trend, as well as potential entry and exit points. The RSI is useful for identifying overbought and oversold conditions, which can be an indication of a potential trend reversal. The MACD is often used to identify changes in the momentum of a trend, while Bollinger Bands are useful for measuring volatility and identifying potential support and resistance levels. Fibonacci retracement is a valuable tool for identifying potential price levels where a trend may reverse, based on key levels of support and resistance.
Ultimately, the most effective trading indicator will depend on the trader’s individual preferences, trading style, and the specific market conditions they are analyzing. It is important to thoroughly understand the indicators being used and to consider them in conjunction with other forms of analysis, such as fundamental analysis and market sentiment. Trading indicators can provide valuable insights and help traders make informed decisions, but they should not be relied on as the sole basis for trading decisions.

